Messaging Systems
Message queues are a method for communication between services. They have a wide range of use cases and are helpful when you want to scale applications. A number of HTTP REST API services that want to communicate with each other require that the services know each other’s addresses. Whereas when using message queues, messages are sent to and received from the message queue, respectively.
In this section we will be using a messaging system called NATS, to explore the benefits of messaging. Before we get started we will have a look at the basics of NATS.
In NATS applications are communicating by sending and receiving messages. These messages are addressed and identified by subjects. The sender publishes the message with a subject. The receivers subscribe to subjects to get the published messages. In the default publish-subscribe model of operation, all the subscribers of the subject receive the published message. It is also possible to use a queue model, where each published message is given just to one subscriber.
NATS provides some different message delivery semantics or modes of operation. The basic functionality provided by Core NATS is at most once messaging: if no subscribers are listening on the subject (no subject match), or are not active when the message is sent, the message is not received. By using the Jetstream functionality, it is also possible to achieve at least once or exactly once messaging with persistence.
With these in mind, we can design our first application that uses messaging for communication.
We have a data set of 100000 JSON objects that we need to do some heavy processing on and then save the processed data. Unfortunately processing a single JSON object takes so long that processing all of the data would require hours of work. To solve this I've split the application into smaller services that we can scale individually.
The application is divided in 3 parts:
- Fetcher, which fetches unprocessed data and passes it to NATS.
- Mapper, which processes the data from NATS and after processing sends it back to NATS.
- Saver, which receives the processed data from NATS and finally (could) save it.

As mentioned the messaging in NATS is centered around subjects. In general, there is one subject per purpose. The app uses four subjects:

Fetcher splits the data into chunks of 100 objects and keeps a record of which chunks have not been processed. The application is designed so that the Fetcher can not be scaled.
The Fetcher subscribes to subject mapper_status and will wait for a Mapper to publish a message confirming that it's ready to process data. When the Fetcher receives this information, it publishes a chunk of data to subject mapper_data and starts again from the beginning.
As mentioned, when a mapper is ready to process more data, it publishes the info of availability to subject mapper_status. It also subscribes to subject mapper_data. When the Mapper gets a message, it processes it and publishes the processed data to subject saver_data and starts all over again. The subject mapper_data operates in queue mode so each published message is received by only one Mapper.
The Saver subscribes to subject saver_data. Once receiving a message it saves it and publishes an acknowledgement message in the subject processed_data. The Fetcher subscribes to this subject and keeps track of what chunks of data have been saved. So even if any part of the application crashes all of the data will eventually be processed and saved. Also, the subject saver_data is used in queue mode so each chunk of processed data is taken care of only one Saver.
For simplicity, saving to a database and fetching from external API are omitted from our app.
Before deploying the app we shall use Helm to install NATS into our cluster. Instead of the Helm chart provided by the NATS team, we shall use the chart provided by Bitnami.
The chart is documentation describe a set of parameters that can be used to modify the NATS configuration. Let us now disable the authentication by setting auth.enabled to value false.
Parameters can be set in the installation as follows:
$ helm install --set auth.enabled=false my-nats oci://registry-1.docker.io/bitnamicharts/nats

  NAME: my-nats
  LAST DEPLOYED: Wed May  8 22:57:17 2024
  NAMESPACE: default
  STATUS: deployed
  REVISION: 1
  ...
  NATS can be accessed via port 4222 on the following DNS name from within your cluster:

   my-nats.default.svc.cluster.local

  NATS monitoring service can be accessed via port 8222 on the following DNS name from within your cluster:

    my-nats.default.svc.cluster.local

  To access the Monitoring svc from outside the cluster, follow the steps below:

  1. Get the NATS monitoring URL by running:

      echo "Monitoring URL: http://127.0.0.1:8222"
      kubectl port-forward --namespace default svc/my-nats 8222:8222

  2. Open a browser and access the NATS monitoring browsing to the Monitoring URL
  ...
The installation prints many kinds of useful info for us.
We are now ready to deploy our app that uses nats.js as the client library. Note that the example app uses nats.js version 1.5. The current version of the library has
The deployment.yaml that passes the connect URL nats://my-nats:4222 to pods in env variable NATS_URL looks like the following:
apiVersion: apps/v1
kind: Deployment
metadata:
  name: mapper-dep
spec:
  replicas: 10
  selector:
    matchLabels:
      app: mapper
  template:
    metadata:
      labels:
        app: mapper
    spec:
      containers:
        - name: mapper
          image: jakousa/dwk-app9-mapper:0bcd6794804c367684a9a79bb142bb4455096974
          env:
            - name: NATS_URL
              value: nats://my-nats:4222
---
apiVersion: apps/v1
kind: Deployment
metadata:
  name: fetcher-dep
spec:
  replicas: 1
  selector:
    matchLabels:
      app: fetcher
  template:
    metadata:
      labels:
        app: fetcher
    spec:
      containers:
        - name: fetcher
          image: jakousa/dwk-app9-fetcher:0bcd6794804c367684a9a79bb142bb4455096974
          env:
            - name: NATS_URL
              value: nats://my-nats:4222
---
apiVersion: apps/v1
kind: Deployment
metadata:
  name: saver-dep
spec:
  replicas: 1
  selector:
    matchLabels:
      app: saver
  template:
    metadata:
      labels:
        app: saver
    spec:
      containers:
        - name: saver
          image: jakousa/dwk-app9-saver:0bcd6794804c367684a9a79bb142bb4455096974
          env:
            - name: NATS_URL
              value: nats://my-nats:4222
After applying the deployments we can confirm that everything works by reading the logs of the fetcher - kubectl logs fetcher-dep-7d799bb6bf-zz8hr -f:
Ready to send #827
Sent data #827, 831 remaining
Ready to send #776
Sent data #776, 830 remaining
Ready to send #516
Sent data #516, 829 remaining
Ready to send #382
Sent data #382, 828 remaining
Ready to send #709
...
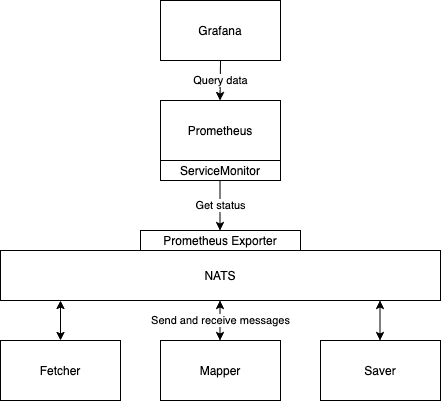
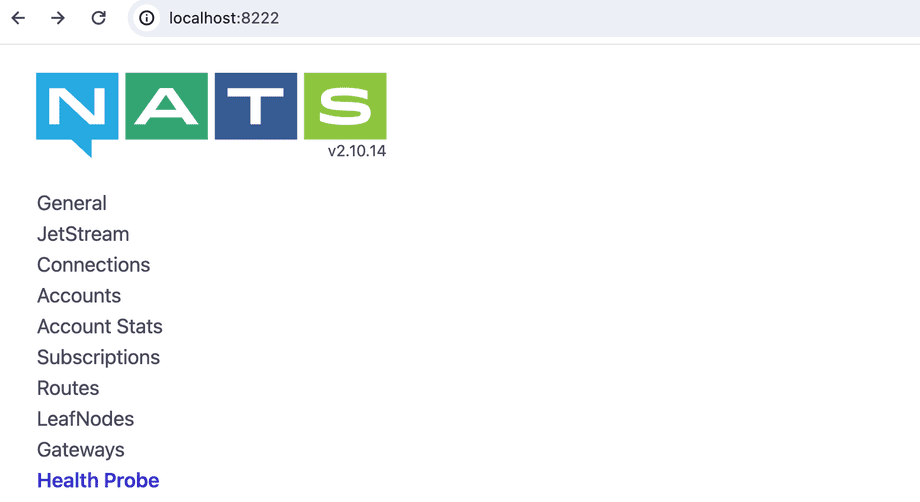
We'll want to monitor the state of NATS as well. NATS has a web service that provides many kinds of data for monitoring. We can access the service from the browser with kubectl port-forward my-nats-0 8222:8222 in http://localhost:8222:
We are already committed to using Prometheus for monitoring and for that, we need to do some configurations. Firstly we have to enable the Prometheus exporter, which exposes the metrics to port 7777. From the Helm chart documentation we find out that metrics.enabled should be set to true to enable metrics.
The command helm upgrade does the trick:
$ helm upgrade --set metrics.enabled=true,auth.enabled=false my-nats oci://registry-1.docker.io/bitnamicharts/nats

  ...
  3. Get the NATS Prometheus Metrics URL by running:

    echo "Prometheus Metrics URL: http://127.0.0.1:7777/metrics"
    kubectl port-forward --namespace default svc/my-nats-metrics 7777:7777

  4. Access NATS Prometheus metrics by opening the URL obtained in a browser.
The output already gives us instructions on how we can connect to the exported with the browser. Let us do it to ensure that everything works:
kubectl port-forward --namespace default svc/my-nats-metrics 7777:7777
Connecting Prometheus to the exporter requires a new resource ServiceMonitor, which is another Custom Resource Definition (CDR).
We could create the resource by ourselves but that is not needed since with a little more configuration, the Helm chart will do it for us. The following settings will create the ServiceMonitor:
´´´ metrics.serviceMonitor.enabled=true metrics.serviceMonitor.namespace=prometheus ´´´
Since we are already setting value to quite many parameters, let us define those in a file:
myvalues.yaml
´´´yaml auth: enabled: false
metrics: enabled: true serviceMonitor: enabled: true namespace: prometheus ´´´
Now we are ready to upgrade the chart:
´´´bash helm upgrade -f myvalyes.yaml my-nats oci://registry-1.docker.io/bitnamicharts/nats ´´´
We can confirm that the ServiceMonitor my-nats-metrics is indeed created:
´´´bash $ kubectl get servicemonitors.monitoring.coreos.com -n prometheus NAME AGE kube-prometheus-stack-1714-alertmanager 6d10h kube-prometheus-stack-1714-apiserver 6d10h kube-prometheus-stack-1714-coredns 6d10h kube-prometheus-stack-1714-kube-controller-manager 6d10h kube-prometheus-stack-1714-kube-etcd 6d10h kube-prometheus-stack-1714-kube-proxy 6d10h kube-prometheus-stack-1714-kube-scheduler 6d10h kube-prometheus-stack-1714-kubelet 6d10h kube-prometheus-stack-1714-operator 6d10h kube-prometheus-stack-1714-prometheus 6d10h kube-prometheus-stack-1714644114-grafana 6d10h kube-prometheus-stack-1714644114-kube-state-metrics 6d10h kube-prometheus-stack-1714644114-prometheus-node-exporter 6d10h my-nats-metrics 8m8s ´´´
We still need a suitable label for our configuration so that Prometheus knows to listen to the NATS.
Let's use the label that the already existing ServiceMonitors are using. We can check it with the following commands:
$ kubectl -n prometheus get prometheus
  NAME                                    VERSION   REPLICAS   AGE
  kube-prometheus-stack-1714-prometheus   v2.51.2   1          39h

$ kubectl describe prometheus -n prometheus kube-prometheus-stack-1714-prometheus
...
  Service Monitor Selector:
    Match Labels:
      Release:  kube-prometheus-stack-1714644114
...
So the label needs to be release: kube-prometheus-stack-1714644114 unless we'd like to define a new Prometheus resource. Label is set as the value of metrics.service.labels.
Label can be attached to the ServiceMonitor with kubectl label command:
´´´bash kubectl label servicemonitors.monitoring.coreos.com -n prometheus my-nats-metrics release=kube-prometheus-stack-1714644114 ´´´
Now Prometheus should have access to the new data. Let's check Prometheus:
$ kubectl -n prometheus port-forward prometheus-kube-prometheus-stack-1714-prometheus-0 9090
Forwarding from 127.0.0.1:9090 -> 9090
Forwarding from [::1]:9090 -> 9090
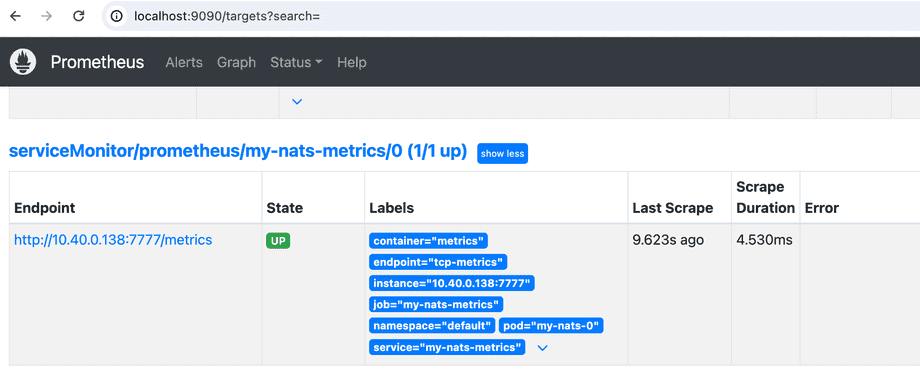
If all goes well, the NATS metrics ServiceMonitor is among the list of targets:
We can now query the data:
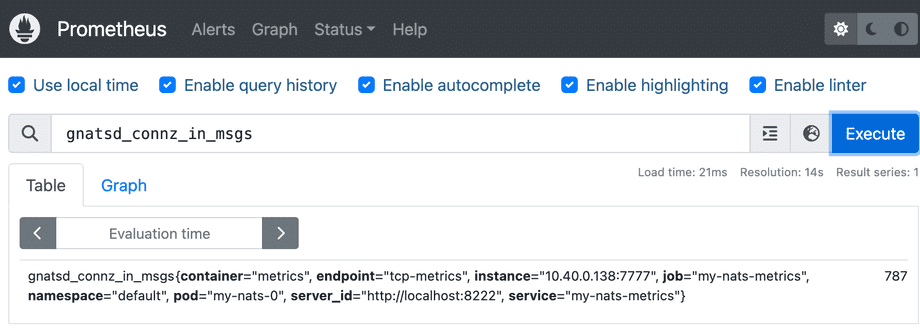
Also the Prometheus API should return a result:
$ curl http://localhost:9090/api/v1/query\?query\=gnatsd_connz_in_msgs
  {
    "status":"success",
    "data":{
        "resultType":"vector",
        "result":[
          {
              "metric":{
                "__name__":"gnatsd_connz_in_msgs",
                "container":"metrics",
                "endpoint":"tcp-metrics",
                "instance":"10.40.0.138:7777",
                "job":"my-nats-metrics",
                "namespace":"default",
                "pod":"my-nats-0",
                "server_id":"http://localhost:8222",
                "service":"my-nats-metrics"
              },
              "value":[
                1715203297.971,
                "1997"
              ]
          }
        ]
    }
  }
If the result here is empty then something is wrong, the result may be a success even if the query doesn't make sense.
Now we just need to add a Grafana dashboard for the data. Let's import a dashboard from here instead of configuring our own.
$ kubectl -n prometheus port-forward kube-prometheus-stack-1602180058-grafana-59cd48d794-4459m 3000Here we can paste the JSON using the "Import dashboard" and by choosing Prometheus as the source on the following page.

And now we have a simple dashboard with data:
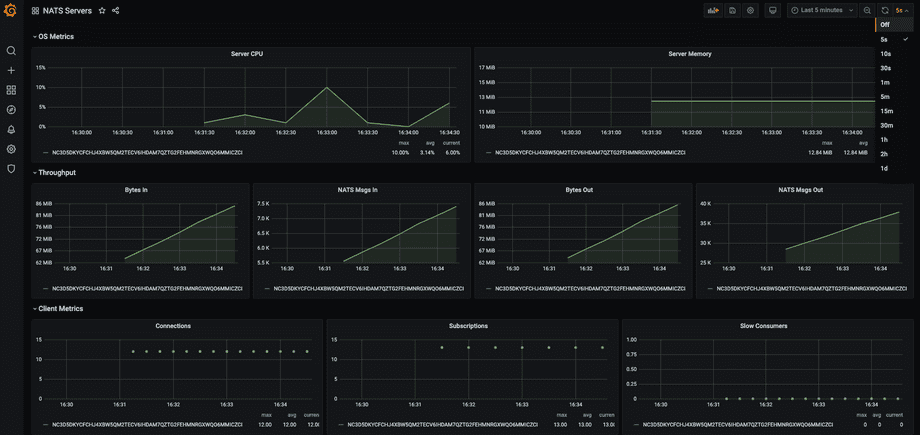
This is now the final configuration:
