Monitoring
Our cluster and the apps in it have so far been pretty much a black box for us. We've thrown stuff in and then hoped that everything works all right. We're now going to use Prometheus to monitor the cluster and Grafana to view the data.
Before we can get started let's look into how Kubernetes applications are managed more easily. Helm uses a packaging format called charts to define the dependencies of an application. Among other things, Helm Charts include information for the version of the chart, the requirements of the application such as the Kubernetes version as well as other charts that it may depend on.
Installation instructions for Helm are found here.
After the installation, we can add the official charts repository:
$ helm repo add prometheus-community https://prometheus-community.github.io/helm-charts
$ helm repo add stable https://charts.helm.sh/stable
Next, we can install the kube-prometheus-stack. By default, this would put everything in the default namespace. Let's create a new namespace and add it there.
$ kubectl create namespace prometheus
$ helm install prometheus-community/kube-prometheus-stack --generate-name --namespace prometheus
...
NAME: kube-prometheus-stack-1635945330
LAST DEPLOYED: Wed Nov  3 15:15:37 2021
NAMESPACE: prometheus
STATUS: deployed
REVISION: 1
NOTES:
kube-prometheus-stack has been installed. Check its status by running:
  kubectl --namespace prometheus get pods -l "release=kube-prometheus-stack-1635945330"
This added a lot of stuff to our cluster. Among other things, it added a number of custom resources. They are a way to extend the Kubernetes APIs to offer new resources that Kubernetes doesn't support out of the box. We will be designing our own custom resources in part 5.
You can remove almost everything with helm delete [name] with the name found using the command helm list -n prometheus. Custom resource definitions are left and have to be manually removed if the need arises. The definitions don't do anything by themselves so leaving them does no harm.
Let us open a way into Grafana so we can see the data.
$ kubectl get po -n prometheus
 NAME                                                              READY   STATUS    RESTARTS   AGE
 kube-prometheus-stack-1602180058-prometheus-node-exporter-nt8cp   1/1     Running   0          53s
 kube-prometheus-stack-1602180058-prometheus-node-exporter-ft7dg   1/1     Running   0          53s
 kube-prometheus-stack-1602-operator-557c9c4f5-wbsqc               2/2     Running   0          53s
 kube-prometheus-stack-1602180058-prometheus-node-exporter-tr7ns   1/1     Running   0          53s
 kube-prometheus-stack-1602180058-kube-state-metrics-55dccdkkz6w   1/1     Running   0          53s
 alertmanager-kube-prometheus-stack-1602-alertmanager-0            2/2     Running   0          35s
 kube-prometheus-stack-1602180058-grafana-59cd48d794-4459m         2/2     Running   0          53s
 prometheus-kube-prometheus-stack-1602-prometheus-0                3/3     Running   1          23s

$ kubectl -n prometheus port-forward kube-prometheus-stack-1602180058-grafana-59cd48d794-4459m 3000
  Forwarding from 127.0.0.1:3000 -> 3000
  Forwarding from [::1]:3000 -> 3000
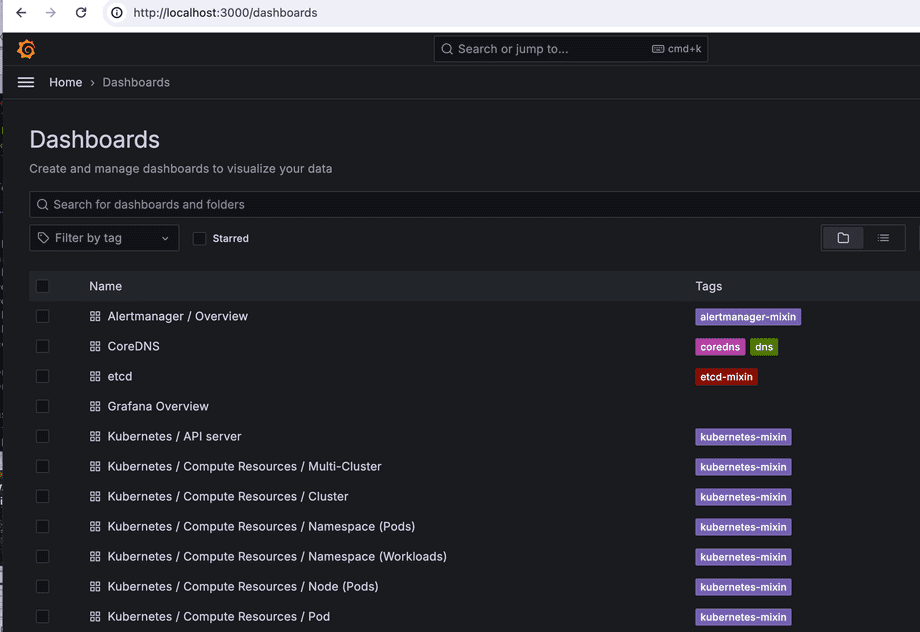
Access http://localhost:3000 with browser and use the credentials admin / prom-operator. At the top left you can browse different dashboards:

The dashboards show already lots of interesting information about the cluster but we'd really like to know more about the apps we're running as well. Let's add Loki so that we can see logs.
To confirm that everything works we should have an application that'll output something to stdout. Let's run the Redis application from previously by applying this manifest. We can keep it running as it'll generate a good amount of log output for us.
The Loki-stack Chart includes everything we need:
$ helm repo add grafana https://grafana.github.io/helm-charts
$ helm repo update
$ kubectl create namespace loki-stack
  namespace/loki-stack created

$ helm upgrade --install loki --namespace=loki-stack grafana/loki-stack

$ kubectl get all -n loki-stack
  NAME                      READY   STATUS    RESTARTS   AGE
  pod/loki-promtail-n2fgs   1/1     Running   0          18m
  pod/loki-promtail-h6xq2   1/1     Running   0          18m
  pod/loki-promtail-8l84g   1/1     Running   0          18m
  pod/loki-0                1/1     Running   0          18m

  NAME                    TYPE        CLUSTER-IP     EXTERNAL-IP   PORT(S)    AGE
  service/loki            ClusterIP   10.43.170.68   <none>        3100/TCP   18m
  service/loki-headless   ClusterIP   None           <none>        3100/TCP   18m

  NAME                           DESIRED   CURRENT   READY   UP-TO-DATE   AVAILABLE   NODE SELECTOR   AGE
  daemonset.apps/loki-promtail   3         3         3       3            3           <none>          18m

  NAME                    READY   AGE
  statefulset.apps/loki   1/1     18m
Here we see that Loki is running in port 3100. As an additional bonus, because we installed the loki-stack, we've got Promtail, which makes it trivial for us to send logs from our applications to Loki. So trivial in fact, that we don't have to do anything except configure Grafana to show Loki.
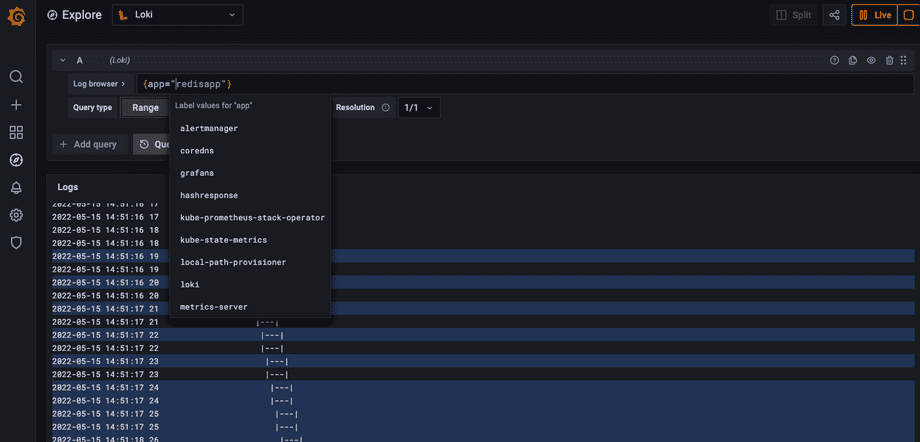
Open Grafana, go to settings, and choose Connections, Data Sources, and then Add data source. Choose Loki and then insert the correct URL. From the output above we can guess that the port should be 3100, the namespace is loki-stack and the name of the service is loki. So the answer would be http://loki.loki-stack:3100. No other fields need to be changed.
Now we can use the Explore tab (compass) to explore the data.

The easy way out
There was an easier way for us to install Prometheus with a few clicks. If you have to install it again you can try this:
- Open Lens
- Right click the cluster icon in the top left and choose "Settings"
- Scroll down and under "Features" under "Metrics" you can press "Install"
A great option especially for your local cluster or hobby cluster.